Kubernetes: I componenti

Nei precedenti articoli abbiamo visto alcuni dettagli di come è costruita l’architettura di Kubernetes.

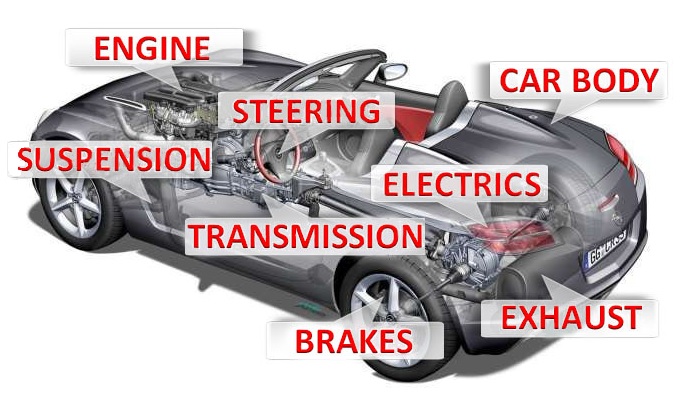
Oggi verranno descritti i meccanismi di funzionamento del motore kubernetes indicando il nome di  ogni componente; per rimanere fedeli al paragone del motore dell’autovettura, parleremo degli alberi a camme, valvole, bronzine, … che afferiscono al Cloud Native

Nota1: Non verrà trattata l’installazione di k8s in Datacenter, Cloud e Laboratorio, la rete ha già messo a disposizione  esaustivi tutorial.

Per i familiarizzare con k8s vi consiglio di utilizzare Minikube (Piattaforma Linux)  Docker Desktop (piattaforma Windows & Mac).

Iniziamo!

Kubernetes Master:  E’ il nodo principale del cluster sul quale girano tre processi vitali per l’esistenza del cluster.

  • kube-apiserver
  • kube-controller-manager
  • kube-scheduler

Nel master node è inoltre presente il DataBase etcd, che memorizza tutte le configurazioni create nel cluster.

I nodi che si fanno carico di far girare le applicazioni e quindi i servizi sono detti worker node. I processi presenti sui worker node sono:

  • Kubelet
  • kube-proxy

kubelet :Un agente che è eseguito su ogni nodo del cluster. Si assicura che i container siano eseguiti in un pod.

Kube-Proxy:  Ha la responsabilità di gestire il networking, dalle regole di Routing a quelle di di Load Balancing.

Nota 2: K8s cercherà di utilizzare tutte le librerie disponibili a livello di  sistema operativo.

kubectl: E’ Il client ufficiale di Kubernetes (CLI) attraverso il quale è possibile gestire il cluster (Kube-apiserver) utilizzando le API.

Alcuni semplici esempi di comandi kubectl sono:

  • kubectl version (indica la versione di k8s installata)
  • kubectl get nodes (scopre il numero di nodi del  cluster)
  • kubectl describe nodes nodes-1 (mostra lo stato di salute del nodo, la piattafoma sulla quale k8s sta girando (Google, AWS, ….) e le risorse assegnate (CPU,RAM)).

Container Runtime: E’ la base sulla quale poggia la tecnologia k8s.

kubernetes supporta diverse runtime tra le quali ricordiamo, container-d, cri-o, rktlet.

Nota 3: La runtime Docker è stata deprecata a favore di quelle che utilizzano le interfacce CRI; le immagini Docker continueranno comunque a funzionare nel  cluster.

Gli oggetti base di Kubernetes sono:

  • Pod
  • Servizi
  • Volumi
  • Namespace

I controller forniscono funzionalità aggiuntive e sono:

  • ReplicaSet
  • Deployment
  • StatefulSet
  • DaemonSet
  • Job

Tra i Deployment è indispensabile menzionare  Kube-DNS che fornisce i servizi di risoluzione dei nomi. Dalla versione kubernetes 1.2 la denominazione è cambiata in Core-dns.

Add-On: servono a configurare ulteriori funzionalità del cluster e sono collocati all’interno del name space kube-system (come Kube-Proxy, Kube-DNS, kube-Dashboard)

Gli Add-on sono categorizzati in base al loro utilizzo:

  • Add-on di Netwok policy. (Ad esempio l’add-on NSX-T si preoccupa della comunicazione tra l’ambiente K8s e VMware)
  • Add-on Infrastrutturali (Ad esempio KubeVirt che consente la connessione con le architetture virtuali)
  • Add-on di Visualizzazione e Controllo (Ad esempio Dashboard un’interfaccia web per  K8s).

Per la messa in esercizio, gli Add-on utilizzano i controller DaemonSetDeployment.

L’immagine di figura 1 riepiloga quanto appena esposto.
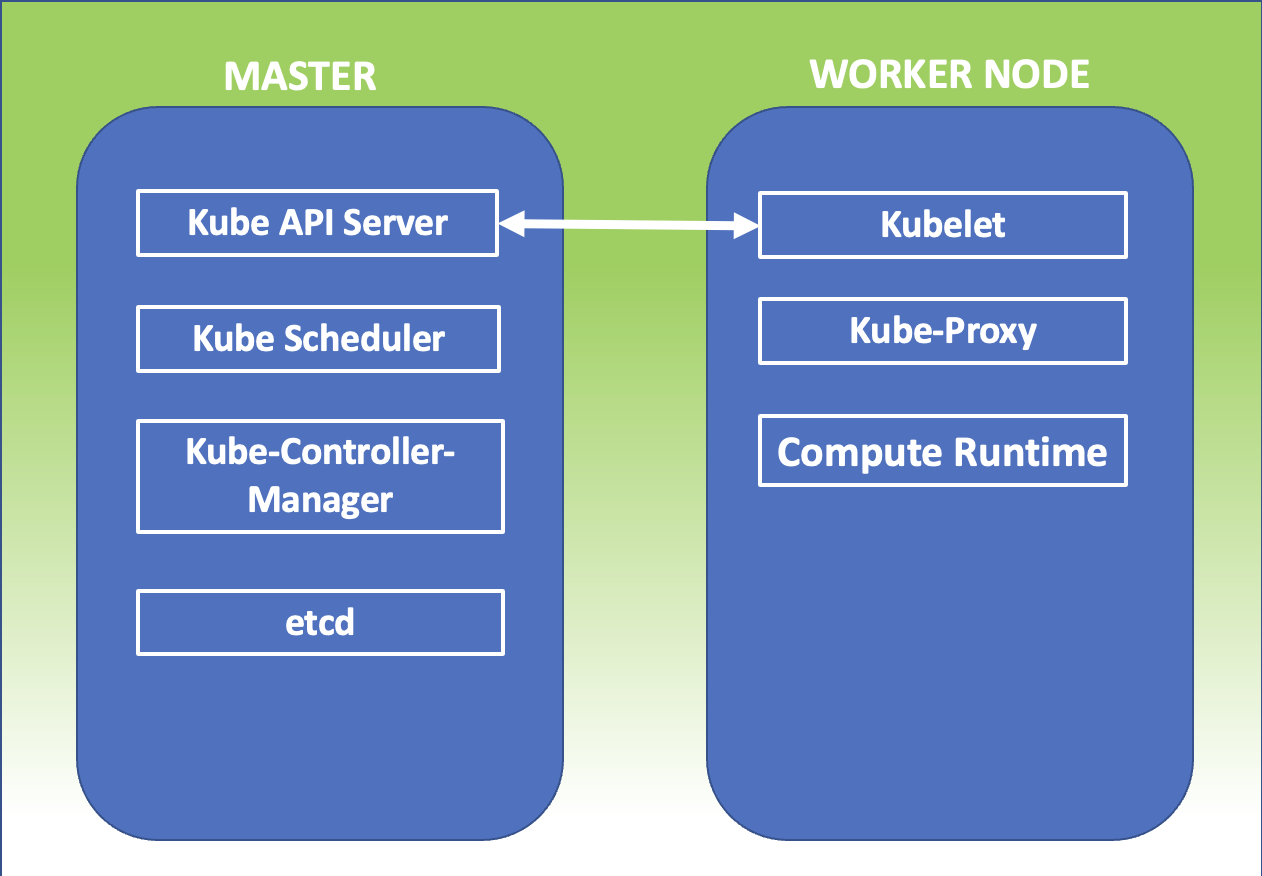
Figura 1

VDrO-Baseline 1

August’s 2022 topic is VDrO (former VAO)

This topic needs an awfully long time to be rightly covered. For this reason, I wrote 5 articles.

The first two will explain the base concepts in front of technology. The others will cover how to set up VDrO for managing the Veeam Replica job, the Veeam Backup job, and the Netapp Storage Replica.

Here below all the direct links to the topic:

Baseline-2VBR-ReplicasVeeam BackupNetapp integration

In these articles, I will not manage how to install VDO software; please refer to the deployment guide (VDrO Guides).

  1. VDrO – Baseline-1:

One of the common requirements of big companies is to automatically manage Disaster Recovery.

Let’s see the decisional process of the IT Manager

These are the VDrO answers.

Let’s move to the VDrO console:

The first steps after logging in (picture 1) is to click on the administrator tab (Yellow on picture 2) and check the license file installed (picture  3)

Picture 1

Picture 2

https://lnx.gable.it/wp-content/uploads/2020/07/VAO-login.jpgPicture 3

Now I’m going to describe the structure of the software components.

VDrO Server:  it shows where the VDrO Server has been installed (Picture 4)

Picture 4

The VDrO architecture is well-represented in picture 5 where three production sites replicate their data to a DR site.

Picture 5

Is it important to fill up the VDrO Server form? Yes, because VDrO creates automatically the DR- Plan documentation.

In my lab, I have just a production site and a  DR site.

VDrO AGENTS: to control the activities of the Backup Server located in production sites, VDrO installs his own agent. The installation task is performed directly from the VDrO console (Picture 6).

Picture 6

vCENTER SERVERS: in my scenario, there are two vCenters; the first one in production and the second in DR site (Picture 7).

(Picture 7)

STORAGE SYSTEM: the most important VDrO news is the integration with storage replication technology. This version supports just Netapp. Picture 8 shows how to add the Storages to VDrO.

Picture 8

The last VDrO article will deal with how to set up and use this great technology.

RECOVERY LOCATION: it’s the place where the DR will be performed (Picture 9). It can be different locations in respect to where VDrO is installed.

Picture 9

In the next rows and pictures, I’ll show which info VDrO needs to work at its best.

In particular, I’m talking about the resources present in the recovery location. In this example the computer resources (Picture 10) and storage resources (picture 11).

Picture 10

Picture 11

The next 10 rows are very important to fix in mind.

How the VDrO can understand which resources are available? In other words, how can I assign resources to my Failover Plan?

The answer is VDrO uses massively tagging to all resources present at the VMware level.

Tagging means that resources can be added to VDRO

But …. is it possible to tag the resources?

Yes, It’s possible because inside VDrO there is the Veeam ONE Business-View component that can be freely used to tag resources.

To have more details about tagging please refer to the VDrO-guide.

One of the most common requests from the customers is to create automatic documentation about failover for both testing and procedures.

VDrO has already templates (in different languages that you can personalize at will) that are automatically filled up from software when you test or perform the Disaster Recovery.

In the next two pictures, it is shown how to set up an e-mail subscription (Picture 12) and configure the report Detail level (Picture 13).

Just remember to subscribe to the report to the right scope.

(Picture 12)

(Picture 13)

The next option is the reason why I fell in love with VDrO (Picture 14).

(Picture 14)

As you can see there is a big choice with DR plan steps. What does it mean?

Let’s see it with an easy example:

My DR plan requires switching on the Domain Controller (VM1) and afterward the SQL Application (VM2).

I want also to be sure that

a. the original VMs are switched off before starting the DR plan

b.  when DR-plan is up and running, the SQL application has to answer port 1433.

What the VDrO can do for you?

With the pre-plan step, you can check the original VMs are switched off.

With a post-plan, you can check that the application answers correctly.

Another great point about plan steps is that you can choose if the actions have to be executed or skipped. In this way, it adds more flexibility to the solution.

(Picture 15)

Picture 16

It’s time to have a break. My next Article (VDrO – Baseline 2) will show scopes and plan components.